Statistic update: January 2024
A quick, fixed format, update on various statistics. This post aims to provide monthly or quarterly insights into the performance of Dikkeklok.nl to show how easy or hard it can be to gain more (page) views, social media followers, etcetera…
The update will consist of the following:
- Site Statistics
- Social Media / Instagram
- Github
- Google Analytics
- Google Search Console
- Affiliate, partner, and advertisement
DikkeKlok went live on 07-06-23.
Statistics for January 2024 - The shop journey begins
In December 2023, the 22nd to be exactly, the first watch to be flipped was purchased. More details below, but first let’s start with the site statistics.
Site Statistics
- Blog posts added: 17
Store
To begin, I still had some personal watches that I added to the site in 2023. I would like to exclude these from the whole RoadtoRolex ‘financial’ count. I will still report on the sales, however, I will add a disclaimer where needed.
- Watches added to the shop: 1
- Watches moved to sold: 1
- Watches moved to reserved: 1
[1]: Sold from private collection. [2]: The Rodania Chronograph is still in my private collection. I decided to keep this one for a little longer.
Social Media / Instagram
- Posts added: 2
- Followers: 20
Github
- 12 contributions in January 2024 by https://github.com/Dikkeklok, the day-to-day user account.
Contributions to main, excluding merge commits:
Google Analytics - Snapshot
- New Users: 316
- Average engagement time: 1m 58s
| First user default channel group | New users [1] | Engaged sessions [2] | Engagement rate | Engaged sessions per user | Average engagement time [3] |
|---|---|---|---|---|---|
| Organic Search | 222 | 106 | 0.7969924812 | 0.954954955 | 142.0720721 |
| Direct | 50 | 21 | 0.42 | 0.724137931 | 92.20689655 |
| Organic Social | 40 | 14 | 0.56 | 0.6666666667 | 45.85714286 |
| Referral | 4 | 3 | 0.6 | 1 | 32 |
[1]: New users: The number of people who have never visited your site or app before in the specified date range
[2]: Engaged sessions: The number of sessions that lasted longer than 10 seconds, or had a conversion event, or had 2 or more screen or page views.
[3]: Average engagement time: The average length of time that the app was in the foreground, or the web site had focus in the browser.
Dashboard can be found: here.
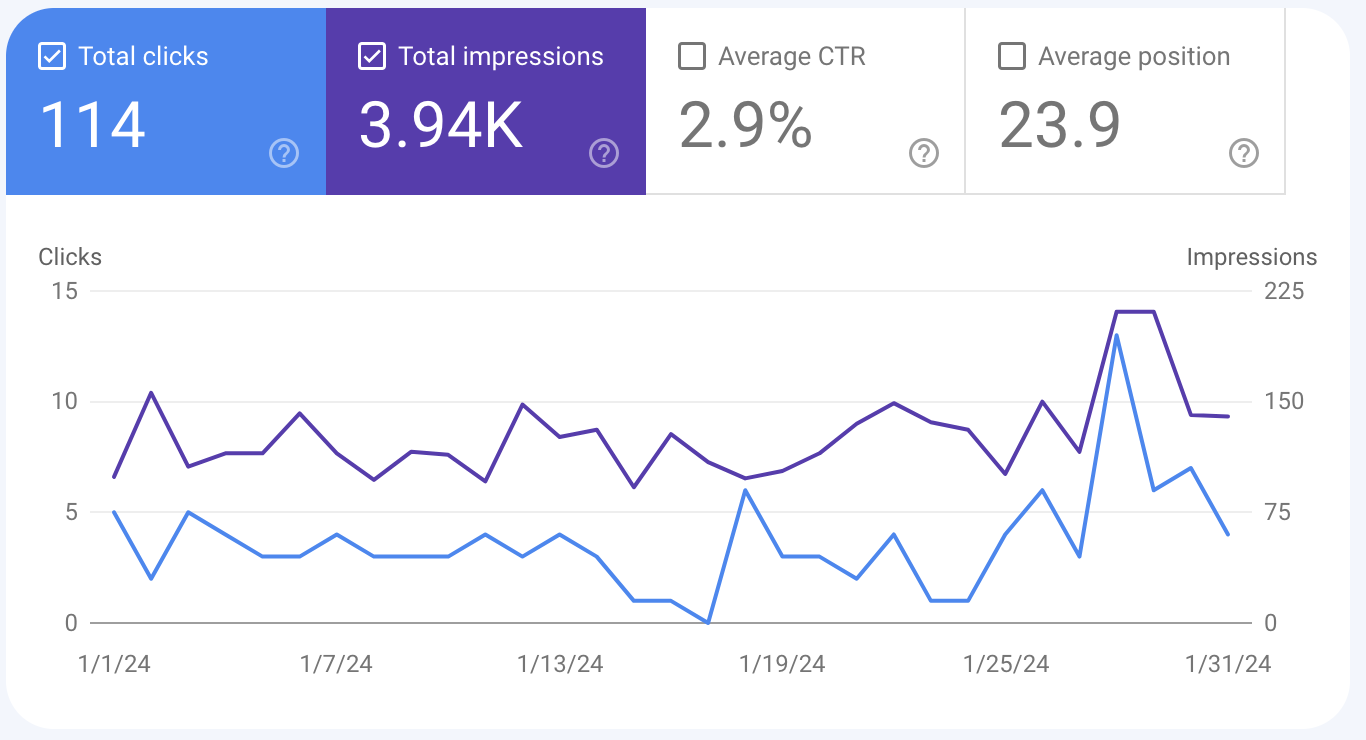
Google Search Console
- Sitemap Discovered pages: 67
-
- Indexed: 19
-
- Not indexed: 48
- Total clicks: 114
- Total impressions: 3942
- Average CTR: 2.9%
| Device | Clicks | Impressions | CTR | Position |
|---|---|---|---|---|
| Mobile | 80 | 2529 | 3.2% | 19.2 |
| Desktop | 32 | 1348 | 2.4% | 33.4 |
| Tablet | 2 | 65 | 3.1% | 11.1 |
Total impressions: How many times a user saw a link to your site in search results.
Average CTR: The percentage of impressions that resulted in a click.
Dashboard can be found: here
Raw download of figures available: here.
Bing Webmasters Tools
- Total clicks: 1
- Total impressions: 5
- Average CTR: 20%
This proves that Bing is terrible in comparison to Google. Apart from updating the sitemap (making sure that pages are indexed), I will not spend time optimizing Bing.
Affiliate, partner, and advertisement
Statistics on affiliate, partner, and ad returns will be covered in a separate finance update. For now, we only have Bol. Other partners have not been included.
Bol.com
- Total views: 833 (excludes text links)
- Total clicks: 2
- Orders: 0
Conclusion
All in all, I think overall growth has been decent. I did see more clicks so that is nice. I’m not entirely sure I’d like to continue with these manual monthly updates, so I might switch to a half-yearly/yearly one.