Statistic update: 2023
A quick, fixed format, update on various statistics. This post aims to provide monthly or quarterly insights into the performance of Dikkeklok.nl to show how easy or hard it can be to gain more (page) views, social media followers, etcetera…
The update will consist of the following:
- Site Statistics
- Social Media / Instagram
- Github
- Google Analytics
- Google Search Console
- Affiliate, partner, and advertisement
DikkeKlok went live on 07-06-23.
Statistics for 2023
The domain Dikkeklok was purchased on 06-06-2023, RoadtoRolex.nl on 23-06-2023.
Site Statistics
- Blog posts added: 17
- Watches added to the shop: 4
- Watches moved to sold: 3
Social Media / Instagram
Launch of the DikkeKlok Instagram account
- Posts added: 26
- Followers: 16
Github
- 245 contributions in 2023 by https://github.com/Dikkeklok, the day-to-day user account.
Contributions to main, excluding merge commits:
Google Analytics - Snapshot
- Users: 402
- New Users: 727
- Average engagement time: 1m 07s
| First user default channel group | New users | Engaged sessions | Engagement rate | Engaged sessions per user | Average engagement time |
|---|---|---|---|---|---|
| Organic Search | 367 | 203 | 0.7224199288256228 | 1.041025641025641 | 88.43589743589743 |
| Direct | 282 | 120 | 0.4878048780487805 | 0.7407407407407407 | 48.888888888888886 |
| Organic Social | 58 | 23 | 0.5348837209302325 | 0.6216216216216216 | 28.64864864864865 |
| Referral | 20 | 8 | 0.5 | 0.7272727272727273 | 76.18181818181819 |
Active users (or just “Users”): The number of people who engaged with your site or app in the specified date range.
New users: The number of people who have never visited your site or app before in the specified date range.
Engaged sessions: The number of sessions that lasted longer than 10 seconds, or had a conversion event, or had 2 or more screen or page views.
Average engagement time: The average length of time that the app was in the foreground, or the web site had focus in the browser.
Dashboard can be found: here.
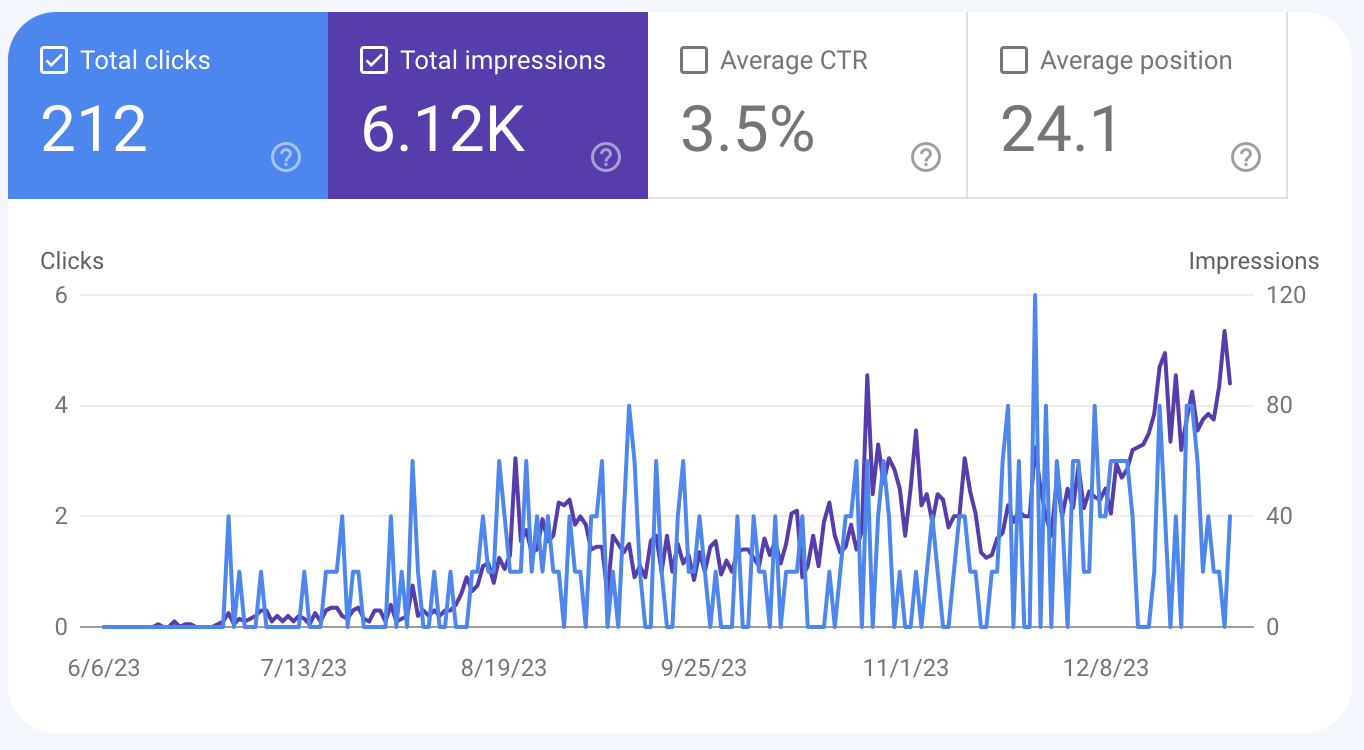
Google Search Console
I went live with Google Search Console on Tuesday, June 6th. The first impression was on Friday, June 16th.
So far:
- Sitemap Discovered pages: 44
- Total clicks: 212
- Total impressions: 6121
- Average CTR: 3.5%
| Device | Clicks | Impressions | CTR | Position |
|---|---|---|---|---|
| Mobile | 161 | 3899 | 4.13% | 20.48 |
| Desktop | 44 | 2131 | 2.06% | 31.22 |
| Tablet | 7 | 91 | 7.69% | 12.38 |
Total impressions: How many times a user saw a link to your site in search results.
Average CTR: The percentage of impressions that resulted in a click.
Dashboard can be found: here
Raw download of figures available: here.
Bing Webmasters Tools
- URLs discovered: 44
- Total clicks: 5
- Total impressions: 35
- Average CTR: 14.29%
Affiliate, partner, and advertisement
Statistics on affiliate, partner, and ad returns will be covered in a separate finance update. For now, we only have Bol. Other partners have not been included.
Bol.com
- Total views: 2459 (excludes text links)
- Total clicks: 14
- Orders: 0
Conclusion
I am really happy with everything that has been achieved already. Being able to reach 727 new users (reported in Analytics), and 212 clicks from 6121 Google impressions feels great. As for improvements, it would be nice to have a higher CTR (currently 3.5%) and to be able to get some traction on social media. I think this would naturally increase the affiliate, partner, and advertisement results.
All in all, I think it has been a successful launch and 2023. Let’s see what 2024 will bring!